
When I first opened Google Ads reports, I felt overwhelmed. There were too many numbers. Clicks, impressions, CTR, conversions—it looked important, but I didn’t know what actually mattered.
That’s when I started learning google ads analytics for beginners, and everything became clearer. I realized that data is not the problem. The problem is knowing what to focus on.
If you want to run better campaigns, you don’t need more data. You need the right understanding of it.
Key Takeaways
- Google Ads analytics helps you understand what is working and what is not
- Not all metrics are equally important
- Conversion data matters more than clicks
- Data should guide decisions, not confuse you
- Simple analysis leads to better campaign performance
What Is Google Ads Analytics (Simple Explanation)
Google Ads analytics is the process of analyzing your campaign data to improve performance.
It answers key questions like:
- Which ads are getting clicks?
- Which keywords are converting?
- Where are you losing money?
Once I understood this, I stopped looking at data randomly and started using it to make better decisions.
Why Analytics Matters More Than Setup
Setting up a campaign is only the beginning.
What actually improves results is what you do after the campaign is live.
Analytics helps you:
- Identify winning campaigns
- Fix underperforming ads
- Improve conversion rates
- Reduce wasted spend
Without analytics, you are guessing. With analytics, you are optimizing.
Step 1: Focus on the Right Metrics
When I started, I tried to track everything.
That didn’t work.
Now I focus on a few key metrics:
- Click-through rate (CTR)
- Conversion rate
- Cost per conversion
These tell me whether my campaigns are effective. Everything else supports these core metrics.
Step 2: Understand Click-Through Rate (CTR)
CTR shows how many people click your ad after seeing it.
If CTR is low, your ad is not engaging.
To improve it, I:
- Rewrite headlines
- Add stronger benefits
- Match keywords with ad copy
Improving CTR also helps with ad performance and cost efficiency.
Step 3: Analyze Conversion Rate
Conversion rate tells you how many clicks turn into results.
If clicks are high but conversions are low, something is wrong.
Usually, the issue is:
- Poor landing page
- Weak offer
- Mismatch between ad and page
Fixing conversion rate is one of the fastest ways to improve performance.
Step 4: Track Cost per Conversion
This is one of the most important metrics.
It tells you how much you are spending to get results.
I always compare:
- Cost per conversion
- Value of conversion
This helps me understand profitability.
Step 5: Identify High and Low Performing Keywords
Not all keywords perform the same.
I analyze:
- Which keywords drive conversions
- Which ones waste budget
If you’re unsure how to find better keywords, explore: how to find ppc keywords
Better keyword targeting improves overall campaign efficiency.
Step 6: Use Analytics to Improve ROI
Analytics is directly connected to profitability.
I use data to:
- Increase budget for profitable campaigns
- Pause underperforming ads
- Improve targeting
If you want to go deeper into this, read: track roi from ppc campaigns
Understanding ROI helps you scale confidently.
Step 7: Improve Campaign Efficiency
One of my biggest learnings was that small improvements add up.
Using analytics, I:
- Adjust bids
- Test ad variations
- Improve landing pages
If your campaigns feel expensive, this can help: reduce ppc cost without losing traffic
Efficiency is what separates average campaigns from profitable ones.
Step 8: Avoid Overanalyzing Data
This is a mistake I made early.
Too much data can slow you down.
Now I follow a simple approach:
- Focus on key metrics
- Make one change at a time
- Measure results
This keeps optimization simple and effective.
Common Mistakes Beginners Make with Analytics
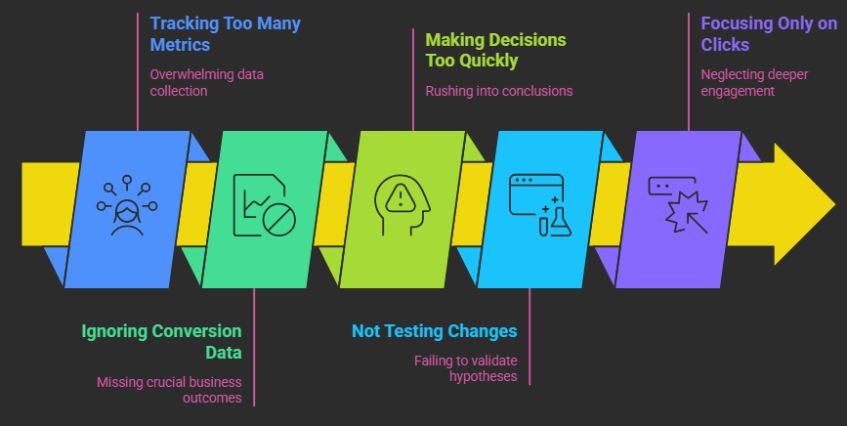
I’ve made these mistakes myself:
- Tracking too many metrics
- Ignoring conversion data
- Making decisions too quickly
- Not testing changes
- Focusing only on clicks
Avoiding these mistakes helps you use data more effectively.
How Long Does It Take to Understand PPC Data?
From my experience:
- First week: basic understanding
- 2–3 weeks: pattern recognition
- 1–2 months: confident decision-making
The more you work with data, the easier it becomes.
What Actually Makes Google Ads Analytics Work
Analytics works when you use it to make decisions.It’s not about numbers.It’s about action.When I started using data to:
- Improve ads
- Adjust targeting
- Optimize landing pages
That’s when I saw real results.
Frequently Asked Questions
1. What is the most important metric in Google Ads?
Conversion rate and cost per conversion are the most important because they directly impact your campaign’s profitability.
2. How often should I check my analytics?
You should review your data regularly, but avoid checking too frequently. Weekly analysis works best for most campaigns.
3. Why am I getting clicks but no conversions?
This usually means your landing page or targeting is not aligned with user intent. Improving relevance can fix this issue.
4. Can beginners understand Google Ads analytics easily?
Yes, if you focus on key metrics and avoid overcomplicating the process. Start simple and build your understanding over time.
A Smarter Way to Use Data for Better PPC Results
Learning google ads analytics for beginners helped me move from confusion to clarity.
I stopped guessing and started making decisions based on data. That shift improved my campaigns significantly.
If you focus on the right metrics, take action based on insights, and optimize consistently, you won’t just run ads.
You’ll build campaigns that improve over time.